

Latest Version
3.32.0
April 23, 2025
陈朝勇
Tools
Android
2
Free
com.yong.quick_chart
Report a Problem
More About Fast chart
Transform Your Data with Fast Chart: The Ultimate Chart Maker
In today's data-driven world, effective visualization is key to communicating insights clearly and persuasively. Fast Chart stands out as your premier chart-making tool, offering a rich variety of features designed to elevate your data presentation. Whether you're a business professional, educator, or data analyst, Fast Chart provides the tools you need to create stunning visuals effortlessly.
Diverse Chart Options for Every Need
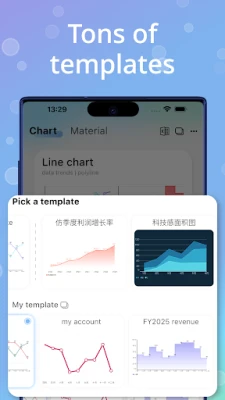
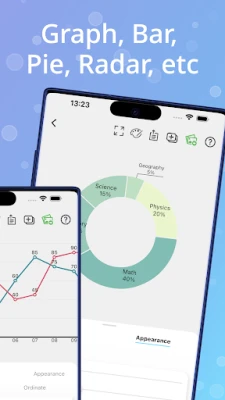
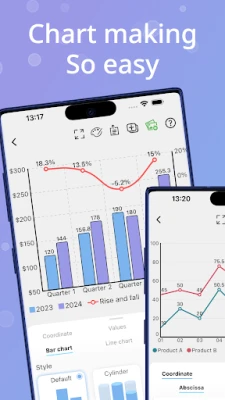
Fast Chart boasts an extensive library of chart types, ensuring you can find the perfect representation for your data. From pie charts that illustrate proportions to line charts that track trends over time, the options are plentiful. Explore bar charts in various formats—horizontal, vertical, stacked, and grouped—to display comparisons effectively. For more complex data relationships, utilize radar charts, scatter plots, funnel plots, and even butterfly charts. Each chart type is designed to enhance clarity and engagement, making your data more accessible to your audience.
Advanced Data Visualization Techniques
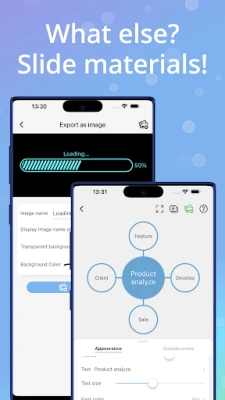
Fast Chart goes beyond traditional charts, offering specialized visualization tools that can transform your data storytelling. Create Venn diagrams to illustrate overlapping concepts, or use progress bars—available in line, circle, and wave formats—to showcase achievements and milestones. For hierarchical data, pyramids provide a clear structure, while rating widgets and circular structure diagrams add a unique flair to your presentations. These advanced options allow you to unlock new dimensions in data representation, making your insights more impactful.
Seamless Chart Creation Process
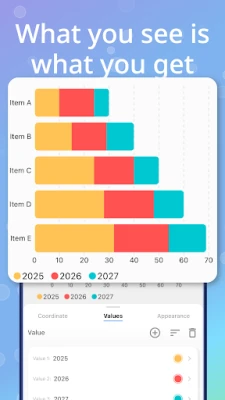
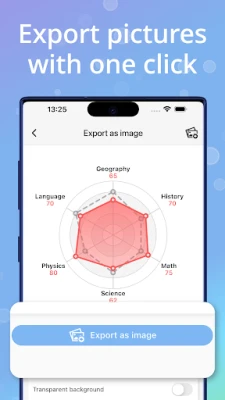
Creating charts with Fast Chart is a straightforward process, thanks to its user-friendly interface. You can easily import data from Excel spreadsheets or build your own tables directly within the application. The intuitive WYSIWYG editor (What You See Is What You Get) allows you to visualize changes in real-time, ensuring that your charts are not only accurate but also visually appealing. This ease of use empowers users of all skill levels to create professional-quality charts without the need for extensive training.
Customizable Designs to Match Your Brand
Fast Chart understands the importance of branding and personalization. With a wide array of customization options, you can tailor your charts to align with your brand identity or project requirements. Adjust colors, fonts, and styles to create a cohesive look that resonates with your audience. Whether you prefer a minimalist design or a vibrant, eye-catching aesthetic, Fast Chart provides the flexibility to bring your vision to life.
Why Choose Fast Chart?
Fast Chart is not just a tool; it's a comprehensive solution for anyone looking to enhance their data visualization capabilities. Here are a few reasons why you should download Fast Chart today:
- Versatility: With a wide range of chart types and advanced visualization options, Fast Chart caters to diverse needs.
- User-Friendly: The intuitive interface and real-time editing make chart creation accessible for everyone.
- Customization: Tailor your charts to reflect your unique style and branding effortlessly.
- Efficiency: Save time with easy data import and streamlined chart creation processes.
Get Started with Fast Chart Today!
Transform your data into compelling visuals that captivate and inform. Fast Chart is perfect for business presentations, academic projects, data analysis, and more. Don’t miss out on the opportunity to elevate your data storytelling. Download Fast Chart today and start creating beautiful, informative charts that make a lasting impression!
Rate the App
User Reviews


Popular Apps


Editor's Choice