Latest Version
March 22, 2026
MGL CodeLabs
Tools
Android
0
Free
com.mlundell.theThingV
Report a Problem
More About TheThingV ThingSpeak/InfluxDB
Unlocking the Power of Data Visualization with ThingSpeak™ and InfluxDB
In today's data-driven world, the ability to visualize information effectively is crucial for making informed decisions. Whether you're monitoring environmental conditions in a greenhouse or tracking weather patterns, having the right tools can make all the difference. This article explores how ThingSpeak™ and InfluxDB can help you create powerful DIY sensor logging applications, along with the features of TheThingV that enhance your data visualization experience.
What is ThingSpeak™?
ThingSpeak™ is an open-source Internet of Things (IoT) platform that allows users to store and retrieve data from various devices using HTTP over the internet. This platform is particularly useful for developers and hobbyists looking to create applications that require real-time data monitoring and analysis. For more information, visit ThingSpeak™.
Understanding InfluxDB
InfluxDB is a powerful time-series database designed for handling high volumes of time-stamped data. It is ideal for applications that require real-time analytics and monitoring. For more details, check out InfluxDB. Note that TheThingV currently supports InfluxDB version 2.XX; older versions are not compatible.
Creating DIY Sensor Logging Applications
With ThingSpeak™ or InfluxDB, you can easily create DIY sensor logging applications. These applications can be used to monitor various environments, such as:
- Greenhouses
- Weather stations
- Smart home systems
By leveraging these platforms, you can gather valuable data and gain insights into your projects.
TheThingV: Your Data Visualization Companion
TheThingV simplifies the process of viewing both recent and historical data from ThingSpeak™. It also supports InfluxDB, allowing you to combine fields from both platforms within the same channel. This flexibility enables you to create comprehensive visualizations that cater to your specific needs.
Seamless Data Handling
TheThingV can manage hundreds of thousands of data points while maintaining smooth scrolling, thanks to its hardware-accelerated graphics. Although the amount of available memory may limit performance, the app is designed to provide a seamless user experience.
Instant Access to Historical Data
One of the standout features of TheThingV is its ability to store downloaded data. This means that when you reopen the app, you can instantly access your historical data. Recent data is automatically added and saved during your app usage, ensuring you always have the latest information at your fingertips.
Data Visualization Features of TheThingV
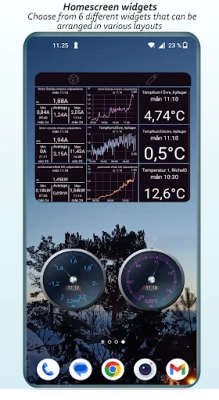
TheThingV offers a range of features that enhance your data visualization experience:
- Multiple Graphs: View single or multiple graphs in the same view, with the option to use different Y-scales for fields with significant value differences.
- Custom Y-Scales: While Y-scales can be set to auto, you can manually adjust the minimum and maximum values as needed.
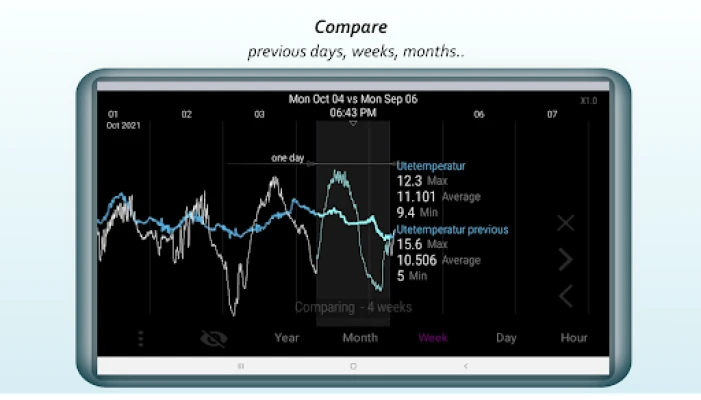
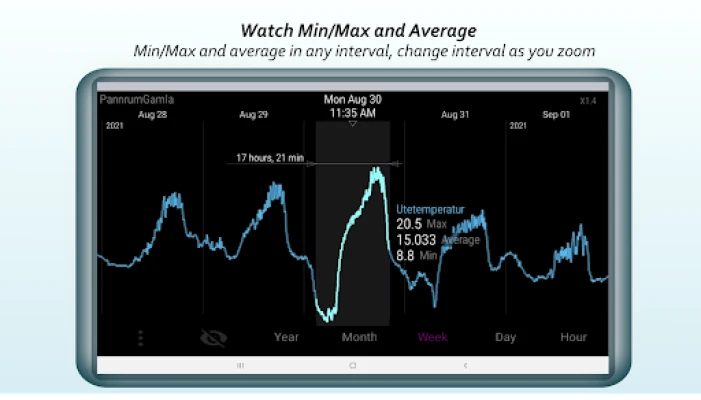
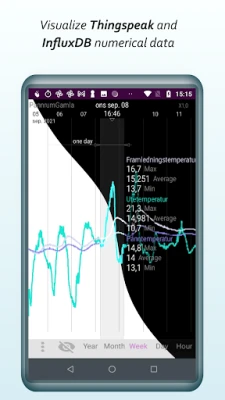
- Interval Analysis: View values, minimum/maximum, and average data over any specified interval.
- Average Graphs: Generate average graphs for hours, days, weeks, and months to identify trends.
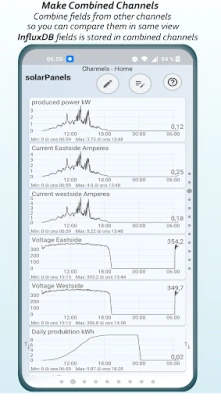
- Combined Channels: Create combined channels to display any field in the same view.
- Smooth Scrolling and Zooming: Enjoy smooth scrolling and zooming capabilities, including double-tap zoom in/out.
- Flexible Scaling: Choose between linear, nonlinear, and logarithmic scales for your graphs.
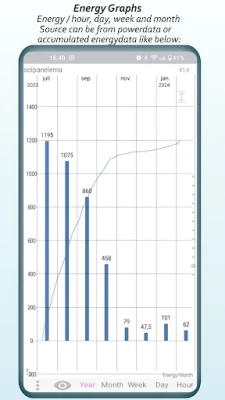
- Energy Graphs: Convert power graphs to energy graphs for more insightful analysis.
- No Row Limit: Unlike the 8000-row limit imposed by ThingSpeak™, TheThingV allows for unlimited data visualization.
- Faster Access: No need to download already stored data, ensuring quicker access to your information.
- Customizable Formats: Choose between 12 or 24-hour formats for time display.
- Graph Customization: Select background and graph colors to suit your preferences.
- Linear X-Axis: Utilize a linear X-axis or a "wheel" for data representation.
- Export/Import Settings: For paid users, the option to export and import settings and data is available.
Conclusion
In summary, ThingSpeak™ and InfluxDB provide robust platforms for creating DIY sensor logging applications, while TheThingV enhances your ability to visualize and analyze data effectively. With its extensive features and user-friendly interface, TheThingV is an invaluable tool for anyone looking to harness the power of data visualization. Start your journey today and unlock the potential of your data!
Rate the App
User Reviews


Popular Apps


Editor's Choice