Latest Version
4.7
December 26, 2024
Gocharting
Finance
Android
0
Free
com.gocharting.gocharting
Report a Problem
More About GoCharting
Unlocking the Power of Advanced Charting: A Comprehensive Guide
In the fast-paced world of trading, having the right tools at your disposal can make all the difference. Advanced charting techniques provide traders with the insights they need to make informed decisions. This article explores various types of charting supported by modern trading applications, highlighting their unique features and benefits.
1. FootPrint Charting: Visualizing Market Depth
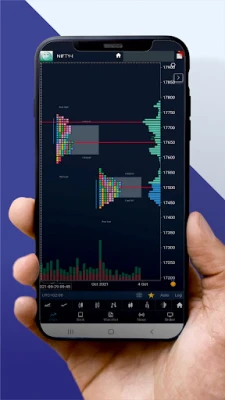
FootPrint Charting is a revolutionary approach that allows traders to visualize market depth and price action in a unique way. By displaying volume at each price level, FootPrint charts help traders identify buying and selling pressure. This method provides a clearer picture of market dynamics, enabling traders to make more informed decisions based on real-time data.
2. MarketFlow Charting: Understanding Market Sentiment
MarketFlow Charting offers a dynamic view of market sentiment by analyzing the flow of orders. This type of charting helps traders gauge the strength of buying and selling activity, allowing them to anticipate potential market movements. By understanding the flow of orders, traders can position themselves advantageously in the market.
3. VolumeFlow Charting: Analyzing Volume Trends
VolumeFlow Charting focuses on the volume of trades executed over time. This charting method helps traders identify trends and reversals by analyzing volume spikes and drops. By correlating price movements with volume, traders can gain insights into the strength of a trend, making it easier to spot potential entry and exit points.
4. Depth of Market: A Real-Time Snapshot
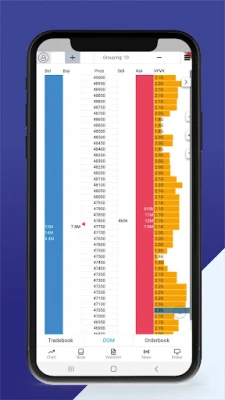
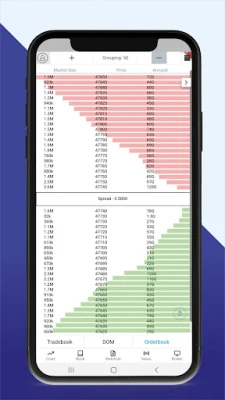
The Depth of Market (DOM) feature provides traders with a real-time snapshot of the order book. This tool displays the number of buy and sell orders at various price levels, giving traders a clear view of market liquidity. By analyzing the DOM, traders can make quick decisions based on current market conditions, enhancing their trading strategies.
5. Time & Sales: Tracking Market Activity
Time & Sales data offers a detailed view of market activity by displaying every trade that occurs in real-time. This information includes the price, volume, and time of each transaction, allowing traders to analyze market behavior closely. By monitoring Time & Sales, traders can identify patterns and trends that may influence their trading decisions.
6. Delta Divergence & Imbalance: Spotting Market Opportunities
Delta Divergence and Imbalance analysis is crucial for identifying potential market reversals. By comparing price movements with volume changes, traders can spot divergences that may indicate a shift in market sentiment. This advanced charting technique helps traders capitalize on market imbalances, providing opportunities for profitable trades.
7. A Comprehensive Suite of Charting Tools
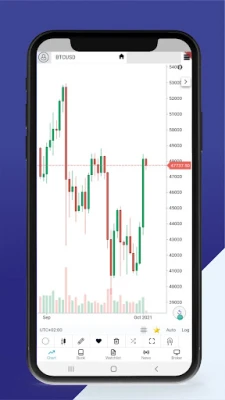
Modern trading applications support over 14 advanced chart types, including Renko and Point & Figure charts. These diverse charting options allow traders to choose the method that best suits their trading style. Additionally, with access to more than 100 technical indicators and 100 drawing tools, traders can customize their charts to enhance their analysis and decision-making processes.
Conclusion: Elevate Your Trading with Advanced Charting
Incorporating advanced charting techniques into your trading strategy can significantly enhance your market analysis and decision-making capabilities. By understanding the various types of charting available, such as FootPrint, MarketFlow, and VolumeFlow, traders can gain valuable insights into market dynamics. With the right tools and knowledge, you can elevate your trading game and navigate the complexities of the market with confidence.
Rate the App
User Reviews
Popular Apps


Editor's Choice


