

Latest Version
7.32.0.0
June 05, 2025
Desmos Inc
Education
Android
0
Free
com.desmos.calculator
Report a Problem
More About Desmos Graphing Calculator
Revolutionizing Mathematics: The Next Generation Graphing Calculator
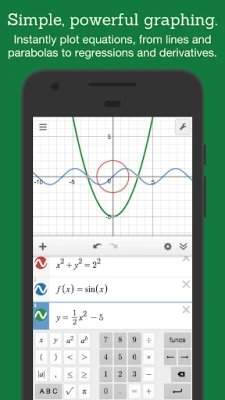
In the quest to enhance mathematical understanding and accessibility, we have developed a groundbreaking graphing calculator that redefines how users interact with equations. Powered by a robust and lightning-fast math engine, this innovative tool allows for instantaneous plotting of a wide range of equations, from simple lines and parabolas to complex derivatives and Fourier series. With user-friendly sliders, demonstrating function transformations becomes effortless, making math not only intuitive but also visually appealing. Best of all, this powerful resource is completely free for everyone.
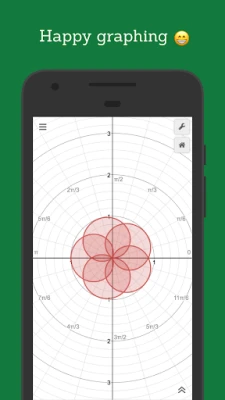
Unmatched Graphing Capabilities
Our graphing calculator excels in its ability to plot various types of graphs, including polar, Cartesian, and parametric forms. Users can graph multiple expressions simultaneously without the need to convert them into the traditional y= format. This flexibility empowers users to explore mathematical concepts without limitations, fostering a deeper understanding of the subject.
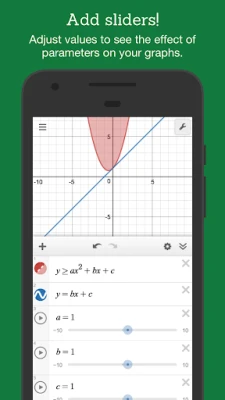
Interactive Sliders for Enhanced Learning
One of the standout features of our calculator is the interactive sliders. These sliders allow users to adjust values in real-time, facilitating a hands-on approach to learning. By animating parameters, users can visualize the effects on the graph, making abstract concepts more tangible and easier to grasp. This interactive experience encourages exploration and experimentation, essential components of effective learning.
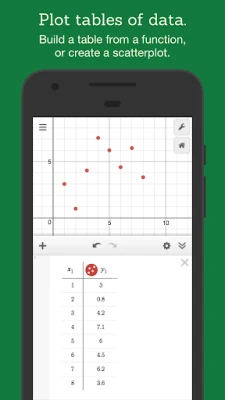
Data Input and Visualization with Tables
Our calculator also supports data input and visualization through tables. Users can easily input data points and plot them on the graph, or create input-output tables for any function. This feature is particularly useful for students and professionals who need to analyze data trends and relationships, making it an invaluable tool for statistical analysis.
Advanced Statistical Functions
Statistics play a crucial role in many fields, and our graphing calculator is equipped to handle various statistical tasks. Users can find best-fit lines, parabolas, and other statistical representations with ease. This functionality not only aids in data analysis but also enhances the learning experience by providing immediate visual feedback on statistical concepts.
Seamless Zooming and Navigation
To ensure a smooth user experience, our calculator features intuitive zooming capabilities. Users can scale the axes independently or simultaneously with a simple pinch gesture, or they can manually adjust the window size for precise control. This flexibility allows users to focus on specific areas of interest within their graphs, enhancing their ability to analyze and interpret data effectively.
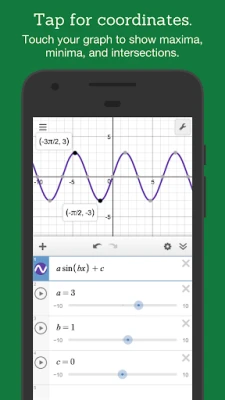
Identifying Points of Interest
Understanding key features of a graph is essential for comprehensive analysis. Our calculator allows users to touch a curve to reveal maximums, minimums, and points of intersection. By tapping on these gray points of interest, users can view their coordinates, providing valuable insights into the behavior of the function. Additionally, users can hold and drag along a curve to see real-time changes in coordinates, further enriching their understanding of the graph's dynamics.
Comprehensive Scientific Calculator Features
Beyond graphing, our calculator functions as a powerful scientific calculator. Users can input any equation they wish to solve, and the calculator will provide the answer instantly. It can handle a variety of mathematical operations, including square roots, logarithms, absolute values, and more, making it a versatile tool for students and professionals alike.
Plotting Inequalities with Ease
Our graphing calculator also supports the plotting of Cartesian and polar inequalities. This feature allows users to visualize the solutions to inequalities, providing a deeper understanding of their implications in various mathematical contexts. By incorporating inequalities into their studies, users can explore a broader range of mathematical concepts and applications.
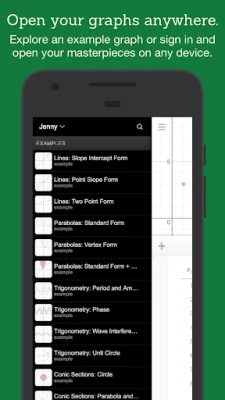
Offline Accessibility for Uninterrupted Learning
In today’s fast-paced world, having access to educational tools without relying on an internet connection is crucial. Our graphing calculator is designed to function offline, ensuring that users can continue their mathematical explorations anytime, anywhere. This feature is particularly beneficial for students in areas with limited internet access, allowing them to engage with math without interruptions.
Discover More at Desmos
To experience the full capabilities of our next-generation graphing calculator, visit www.desmos.com. Explore the free online version and unlock the potential of intuitive, beautiful math. Whether you are a student, educator, or math enthusiast, our calculator is designed to enhance your learning experience and make mathematics more accessible than ever before.
Rate the App
User Reviews


Popular Apps


Editor's Choice