
Latest Version
1.7.0
December 27, 2025
Bernhard Klingenberg, Art of Stat
Education
Android
0
Free
com.artofstat.concepts
Report a Problem
More About Art of Stat: Concepts
Mastering Statistics: A Step-by-Step Guide for Students and Educators
Understanding statistics can be a daunting task for many students and educators. However, with the right tools and resources, grasping these essential concepts becomes an engaging and enlightening experience. The Art of Stat: Concepts app is designed to facilitate this learning journey by providing interactive modules that cover fundamental statistical principles. This article will delve into the key features of the app, highlighting how it can enhance your understanding of statistics through hands-on experience.
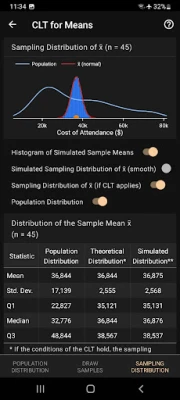
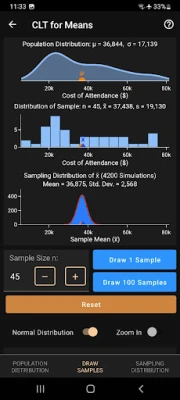
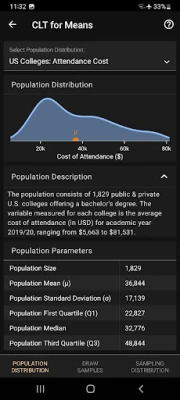
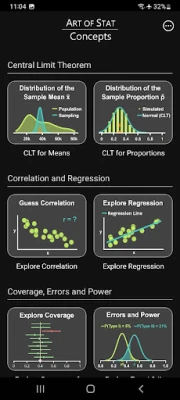
Central Limit Theorem for Means
The Central Limit Theorem (CLT) is a cornerstone of statistical theory. It states that the sampling distribution of the sample mean will approach a normal distribution as the sample size increases, regardless of the population's distribution. The app allows users to:
- Select from various real population distributions, including left-skewed, right-skewed, and symmetric distributions.
- Simulate sampling from these populations to observe how the sampling distribution evolves.
As you increase the sample size, the app visually demonstrates the convergence of the sampling distribution to a normal distribution, reinforcing the concept of the CLT. Users can also compare the sampling distribution of the mean with the original population distribution, both visually and through key statistical metrics.
Central Limit Theorem for Proportions
In addition to means, the app also explores the Central Limit Theorem for Proportions. This module allows users to:
- Examine how sample proportions behave as sample sizes increase.
- Visualize the distribution of sample proportions and understand its implications for statistical inference.
By engaging with this module, users can gain a deeper appreciation for how proportions are distributed and the importance of sample size in achieving reliable results.
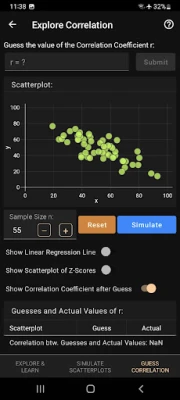
Exploring Correlation
Correlation is a vital concept in statistics that measures the strength and direction of a relationship between two variables. The app provides an interactive platform for users to:
- Create and manipulate points in a scatterplot by tapping on the screen.
- Visualize the regression line and residuals, enhancing understanding of linear relationships.
- Simulate various scatterplots and estimate the correlation coefficient.
This hands-on approach allows students to see firsthand how changes in data points affect correlation, fostering a more intuitive grasp of the concept.
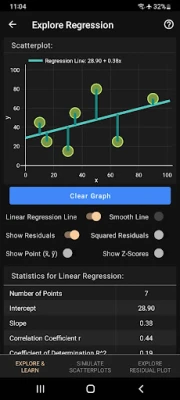
Understanding Linear Regression
Linear regression is a powerful statistical method used to model the relationship between a dependent variable and one or more independent variables. The app's linear regression module enables users to:
- Visualize the regression line and understand its significance in predicting outcomes.
- Analyze residuals to assess the fit of the model.
By experimenting with different datasets, users can learn how to interpret regression results and apply them in real-world scenarios.
Coverage and Errors in Hypothesis Testing
Understanding coverage and errors is crucial for making informed decisions based on statistical analysis. The app offers insights into:
- What 95% coverage for a confidence interval means for population means or proportions.
- The concepts of Type I and Type II errors, including their dependence on sample size and true parameter values.
- Visualizing the power of a hypothesis test and how it relates to sample size and effect size.
This module equips users with the knowledge to interpret confidence intervals and understand the implications of statistical errors, which are essential for effective data analysis.
Conclusion: Empowering Statistical Understanding
The Art of Stat: Concepts app serves as an invaluable resource for both students and educators seeking to deepen their understanding of statistics. By providing interactive modules that cover the Central Limit Theorem, correlation, linear regression, and hypothesis testing, the app transforms complex statistical concepts into accessible and engaging learning experiences. Embrace the journey of mastering statistics step-by-step, and unlock the potential of data-driven decision-making.
Rate the App
User Reviews


Popular Apps


Editor's Choice