

Latest Version
April 06, 2026
STOCKMAP JOINT STOCK COMPANY
Finance
Android
0
Free
vn.stockmap.android
Report a Problem
More About STOCKMAP
Unlocking the Power of STOCKMAP: The Ultimate Tool for Vietnamese Stock Market Investors
In the fast-paced world of stock trading, having the right tools at your disposal can make all the difference. STOCKMAP emerges as a comprehensive platform that integrates advanced cash flow analysis tools, specifically designed for the Vietnamese stock market. This application visually represents real cash flow on charts based on volume data analysis, connecting real-time market data for stocks, bonds, and derivatives.
STOCKMAP's Mission: Bridging the Gap Between Individual and Institutional Investors
The mission of STOCKMAP is clear: to cater to the diverse needs of investors, from beginners to advanced traders. By narrowing the gap between individual investors and professional institutions in the Vietnamese stock market, STOCKMAP empowers users with the insights and tools necessary for informed decision-making.
Key Features of STOCKMAP
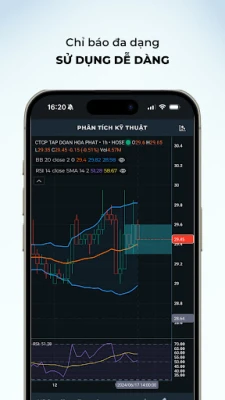
1. Real-Time Cash Flow Tracking on Candlestick Charts
STOCKMAP offers an innovative candlestick chart integrated with a Footprint Chart, a powerful order flow analysis tool. This feature allows users to gain deeper insights into the interaction between price and volume in the market. By examining the candlestick's inner workings, investors can see the total active buying and selling volume at specific price levels, providing a clearer narrative of market dynamics.
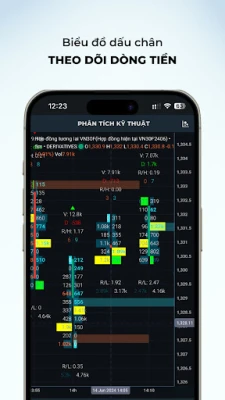
2. Comprehensive Market Liquidity Map
The Heatmap feature stands out as one of the most advanced technical analysis tools available today. It provides a panoramic view of the market, showcasing executed active buy and sell orders alongside pending orders. This allows investors to identify potential liquidity zones, as well as strong support and resistance areas where significant buy and sell orders are waiting.
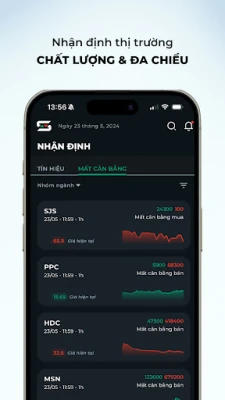
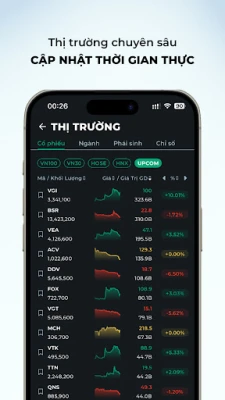
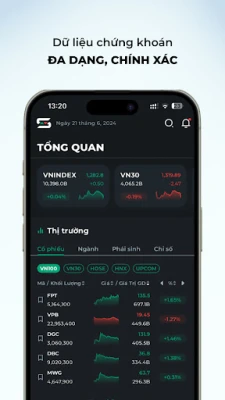
3. Real-Time Market Overview
STOCKMAP keeps users updated with real-time information on various indices, stocks, and bonds. Detailed stock codes, an overview of leading sectors, derivative data, and prominent indices are all displayed visually. The data is meticulously curated by a team of seasoned experts, ensuring that investors can quickly grasp market trends and make informed decisions.
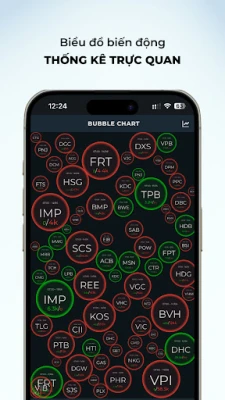
4. Imbalance Volatility Charts
The Bubble Chart tool allows users to monitor information about specific products, assets, or any data-driven items. This visually engaging chart provides more insight than traditional tables, offering information about various securities. The volatility bubble chart at STOCKMAP delivers crucial data, particularly regarding cash flow and supply-demand imbalances—factors that many investors are keen to understand but often find elusive.
5. Efficient Portfolio Management
The Watchlist feature enables users to create and manage a portfolio of stocks of interest in a user-friendly manner. With simple operations, you can easily add or remove stocks and apply filters to optimize your watchlist display, ensuring you stay on top of your investments.
6. Reliable Alerts and Insights
STOCKMAP employs AI technology to provide a robust alert and signal system, helping investors assess stock strength effectively. A variety of filters ensure that you receive timely notifications about unusual fluctuations in the stocks you are monitoring, allowing for quick and effective responses to market changes.
Why Choose STOCKMAP?
STOCKMAP is not just another trading tool; it is a comprehensive solution tailored to meet the unique demands of the Vietnamese stock market. With its advanced features, real-time data, and user-friendly interface, STOCKMAP stands out as an essential resource for both novice and experienced investors. By leveraging the insights provided by STOCKMAP, you can enhance your trading strategies and make more informed investment decisions.
Conclusion: Elevate Your Trading Experience with STOCKMAP
In conclusion, STOCKMAP is revolutionizing the way investors engage with the Vietnamese stock market. Its powerful tools and features provide a competitive edge, enabling users to navigate the complexities of trading with confidence. Whether you are looking to track cash flow, manage your portfolio, or receive timely alerts, STOCKMAP is your go-to platform for achieving investment success. Embrace the future of trading and unlock your potential with STOCKMAP today!
Rate the App
User Reviews


Popular Apps


Editor's Choice